How sustainable is the commodity rebound?


Author Cam Hui

Posted: 29 July 2013

I have seen some buzz and excitement among technical analysts and in the blogosphere about a rebound in the commodity sectors of the stock market. While these sectors were highly oversold and a bounce was not unexpected, my analysis suggest that the sustainability of a rebound is unlikely. The more likely scenario is a sideways consolidation to digest the gains from the tactical rally.

Here is the chart of the metal stocks relative to the market. The group has rallied out of a relative downtrend, which is constructive, but faces some overhead relative resistance. My best guess is a period of sideways consolidation going forward:

Here are the gold stocks against the market. I’m not sure why people are getting so excited here. Sure, the short-term relative downtrend has been broken, but the longer term relative downtrend remains intact.

Here is the relative chart of the energy sector. It bears some semblance to the metals – rally out of a relative downtrend and exhibiting a consolidation pattern.

Longer term, I just get very excited about this sector unless it can show some sustained relative strength to break the pattern of lower relative lows and lower relative highs:

Here is the long term relative chart of Materials. The same comments that I made about energy applies to this sector as well:

The same thing goes for the metals. Well, you get the idea.

Tactically, I also like to watch the high-beta small cap resource stocks relative to their large cap brethren to measure the “animal spirits” of the market to give me clues as to the sustainability of this rebound. Here are the junior golds (GDXJ) relative to the senior olgds (GDX). Unless the juniors can show more strength to break the relative downtrend, it suggests to me that this rally is likely to be brief and fleeting.

Up here in the Great White North, I monitor the relative return of the junior TSX Venture, which is weighted towards the speculative junior resource names, to the more senior and more broadly diversified TSX Index.

Nope. No rebound in animal spirits here either.

The dreams of gold bugs
I also saw some analysis that is supportive of a strong gold rally, but upon further analysis I believe that the analysis could be interpreted in different ways and it is not necessarily supportive of a bullish position in gold. Consider this chart showing the relative performance of the Amex Gold Bugs Index against SPX, which has been rattling around in the blogosphere:

It was pointed out that we are experiencing bullish divergences on the 14-week RSI and in the past three occasions, the HUI/SPX ratio has rallied strongly in favor of HUI. Moreover, the ratio is sitting at a major relative support level and, given the highly oversold conditions and the bullish RSI divergences, conditions are highly suggestive of a strong rally for the golds.

While I would not rule out a tactical rally in gold and gold stocks, I question the sustainability of any bullish thrust. I would point out that the highlighted bullish RSI divergences occurred in a secular bull market for gold and other commodities. It is questionable whether gold remains in a secular bull today. Consider the occasions on the left had side of the chart, where oversold RSI conditions occurred in the HUI/SPX ratio in a bear market. On those occasions, the rebound was only a blip and the downtrend continued soon afterwards.

The key issue to the analysis that underlies the above chart is the question of whether gold is in a bull or bear market. Choose your interpretation and your own conclusion.

As well, there is the Commitment of Traders report showing an off-the-scale reading in the net gold positions of commercials, or hedgers:

The COT report seems highly supportive of a bullish impulse in gold, but consider what happened in 2008 when we saw a similar reading. The COT “buy” signal report date was September 16, 2008. Soon after, the gold price proceeded to tank, though it did recover for several months,

Oh well, back to the drawing board.

Fundamental backdrop is not constructive
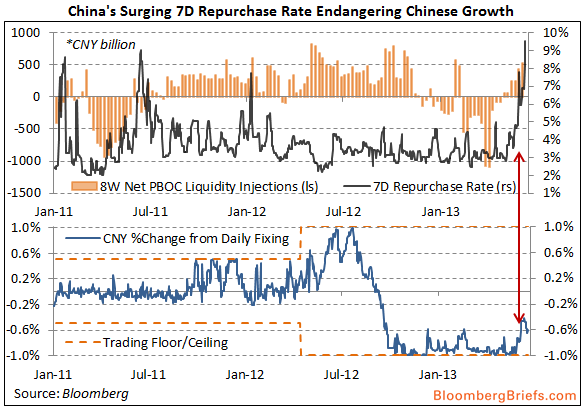
It’s not just technical headwinds that the commodity sectors face, the macro fundamental backdrop does not scream sustainable rebound for these late cycle sectors. Walter Kurtz of Sober Look highlighted this chart from Credit Suisse showing the relative performance of cyclical vs. defensive sectors by region. The US and eurozone ratios are fairly flat, while Japan shows a minor uptick and China, which is the major marginal buyer of commodities, is going south.

Can the commodity sectors rebound strongly in the absence of Chinese demand and a so-so performance from the major developed markets?

The signals from China are clear. The new leadership is intent on re-balancing the  economic growth from an export and infrastructure driven model to a consumer drive model. While the government appeared to have blinked last week when Premier Li Keqiang asserted that growth would not be allowed to go below 7%, it seems that any stimulus measures would be highly targeted and localized. In fact, Bloomberg reported that the government ordered 1400 companies to cut capacity in a highly targeted move to shift the focus away from infrastructure spending:

China ordered more than 1,400 companies in 19 industries to cut excess production capacity this year, part of efforts to shift toward slower, more-sustainable economic growth.

Steel, ferroalloys, electrolytic aluminum, copper smelting, cement and paper are among areas affected, the Ministry of Industry and Information Technology said in a statement yesterday, in which it announced the first-batch target of this year to cut overcapacity. Excess capacity must be idled by September and eliminated by year-end, the ministry said, identifying the production lines to be shut within factories.

China’s extra production has helped drive down industrial-goods prices and put companies’ profits at risk, while a survey this week showed manufacturing weakening further in July. Premier Li Keqiang has pledged to curb overcapacity as part of efforts to restructure the economy as growth this year is poised for the weakest pace since 1990.

Does this sound like a government that is panicked about growth falling below 7% and is anxious to stimulate at all costs? Do these measures sound like they are supportive of a short-term spike in commodity demand?

In short, the rebound in gold and other commodity prices appear to be temporary and the bear trend will likely re-assert itself after a short rebound. This does not look like the start of an intermediate term uptrend.

For commodity bulls, the current environment is like the unfortunate case of being locked up by the secret police and having your interrogator go home for the evening. You may think that the torture is over, but the beatings will continue when he returns in the morning.

Cam Hui is a portfolio manager at Qwest Investment Fund Management Ltd. (“Qwest”). This article is prepared by Mr. Hui as an outside business activity. As such, Qwest does not review or approve materials presented herein. The opinions and any recommendations expressed in this blog are those of the author and do not reflect the opinions or recommendations of Qwest. 

None of the information or opinions expressed in this blog constitutes a solicitation for the purchase or sale of any security or other instrument. Nothing in this article constitutes investment advice and any recommendations that may be contained herein have not been based upon a consideration of the investment objectives, financial situation or particular needs of any specific recipient. Any purchase or sale activity in any securities or other instrument should be based upon your own analysis and conclusions. Past performance is not indicative of future results. Either Qwest or Mr. Hui may hold or control long or short positions in the securities or instruments mentioned.

Uh oh! Is housing in trouble?


Author Cam Hui

Posted: 26 July 2013

I was reviewing some charts after the close and I came upon this chart. Notwithstanding Thursday’s action, which was the result of earnings misses by two homebuilders, what does this chart of the homebuilders ETF (XHB) against the market telling us about market expectations about the housing rebound? On a a relative basis, XHB staged a relative rally from the Eurogeddon lows of 2011, started rolling over in early 2013 and now has violated a relative support level.

Now consider this recent post from Barry Ritholz about private equity seems to have gone overboard on the “rent to flip” in US housing. Mr. Market starting to get nervous about housing, especially if mortgage rates rise any further.

Cam Hui is a portfolio manager at Qwest Investment Fund Management Ltd. (“Qwest”). This article is prepared by Mr. Hui as an outside business activity. As such, Qwest does not review or approve materials presented herein. The opinions and any recommendations expressed in this blog are those of the author and do not reflect the opinions or recommendations of Qwest. 

None of the information or opinions expressed in this blog constitutes a solicitation for the purchase or sale of any security or other instrument. Nothing in this article constitutes investment advice and any recommendations that may be contained herein have not been based upon a consideration of the investment objectives, financial situation or particular needs of any specific recipient. Any purchase or sale activity in any securities or other instrument should be based upon your own analysis and conclusions. Past performance is not indicative of future results. Either Qwest or Mr. Hui may hold or control long or short positions in the securities or instruments mentioned.

What a regime shift looks like


Author Cam Hui

Posted: 16 July 2013

When I first joined Merrill Lynch, I sat next to a young analyst named Savita Subramanian who was working for Rich Bernstein in strategy research. Though we worked in different groups, I can recall sharing with her everything from Factset data tricks to suggestions about her (then) boyfriend. I have the utmost respect for her as a person and as an analyst.

It was with interest that I read (via Business Insider) that Savita Subramanian, who is now BoAML’s head of US equity strategy, raised her year-end SPX target to 1750. One of the key inputs is her estimate of the equity risk premium (ERP):

As such, we have lowered our normalized risk premium assumption in our fair value model for the end of 2013 from 600bp to 475bp, which assumes roughly another 25bp of ERP contraction by year-end. We have also raised our normalized real risk-free rate assumption for year-end from 1.0% to 1.5%. Not only have current and future inflation expectations declined since last fall, but long-term interest rates have also begun to rise recently. Meanwhile, our Rates Strategist Priya Misra also recently raised her interest rate forecasts.

Sorry, Savita. I respectfully disagree.

I hate to beat a dead horse here, but I am afraid that much of the Street still doesn’t understand the global effects of the deleveraging cycle and subsequent Fed intervention on the perception of risk. Here is the same chart, with my annotations in red:

The first part of the chart from 1987 to 2009 represents an economic growth phase powered by rising credit growth and rising financial leverage. The latter part, post-Lehman Crisis, is the deleveraging phase of the long cycle. Just read Ray Dalio’s explanation of the credit cycle using the Monopoly game analogy and you’ll get the idea. If you accept the premise that the two phases of the cycle are different, then you can’t apply the norms of an equity risk premium from one phase to another.

Now consider what the Fed did in the wake of the Lehman Crisis (see my previous posts It’s the risk premium, stupid! and Regime shifts = Volatility). The Federal Reserve intervened with a series of quantitative easing programs, designed to lower interest rates and lower risk premiums. An artificially lower risk premium forces the market to take more risk, reach for yield, invest, etc. It was thought that such actions would kick start a virtuous cycle of more growth, employment and therefore recovery.

Fast forward to May 22, 2013. The Fed signals that it is thinking of tapering off its QE program. The longer term effect of tapering, regardless of its timing, is to allow risk premiums to find their own natural levels. Since they have been artificially depressed by QE, do you think that they would fall further as postulated by BoAML’s analysis?

I recognize that the ERP shot up in the wake of the Lehman Crisis and the various versions of eurozone sovereign debt crisis in the last few years. As fear levels have faded, so should the equity risk premium. Nevertheless, to believe that the ERP will return to pre-crisis levels is to disregard the longer term nature of the deleveraging cycle and the net effects of the Fed’s QE programs which depressed risk premiums globally.

Cam Hui is a portfolio manager at Qwest Investment Fund Management Ltd. (“Qwest”). This article is prepared by Mr. Hui as an outside business activity. As such, Qwest does not review or approve materials presented herein. The opinions and any recommendations expressed in this blog are those of the author and do not reflect the opinions or recommendations of Qwest.

None of the information or opinions expressed in this blog constitutes a solicitation for the purchase or sale of any security or other instrument. Nothing in this article constitutes investment advice and any recommendations that may be contained herein have not been based upon a consideration of the investment objectives, financial situation or particular needs of any specific recipient. Any purchase or sale activity in any securities or other instrument should be based upon your own analysis and conclusions. Past performance is not indicative of future results. Either Qwest or Mr. Hui may hold or control long or short positions in the securities or instruments mentioned.

It’s the risk premium, stupid!


Author Cam Hui

Posted: 9 July 2013

In the past few weeks, I have seen various analysts and commentators stating that either the Fed has fumbled the delivery of its message, or that even if it tapers, the effects will be minor. Here is one example from Comstock Partners:

Last week we wrote that Bernanke could not be happy with the way long bond rates reacted to his press conference answer that the Fed could begin lessening its rate of bond purchases in the next few months, and that he would attempt to sooth the market in yesterday’s press conference following the FOMC meeting. Well, he tried, but ended up making things worse, at least in the perception of the markets.

The Chairman attempted to allay fears by setting specific dates and economic parameters for reducing and eventually eliminating the latest bond purchase program that, until recently, was assumed by the market to be open-ended. He further took pains to assure the markets that just reducing the amount of purchases was not the same as tightening and that the fed funds rate would not likely be increased before early in 2015. He also assured one and all that the decisions would still be data-dependent, and subject to adjustment.

Investors, however, took what Bernanke apparently thought was increased clarity to mean greater hawkishness, and, as a result, bond yields soared as stocks tanked. In addition the markets gave far greater importance to the potential reduction of bond purchases, whereas the Fed attached greater significance to the continuing expansion of their balance sheet.

A history lesson: We want you to take risk
To the contrary, I believe that the Bernanke Fed knows exactly what it is doing with its communications policy. Remember what the intent of the various quantitative easing programs were designed to do. The intent of QE is to lower interest rates, lower the cost of capital and lower the risk premium. In the wake of the Lehman Crisis of 2008, the Fed stepped in with QE1. It followed with QE2 and QE3, otherwise known as QE-Infinity. The Fed first lowered short rates, told the market that it was holding short rates down for a very long, long time. It then followed up with purchases of Treasuries further out on the yield curve and later started to buy Agencies as well in order.

The message from the Fed was: “We want you take take more risk.” Greater risk taking meant that businesses would expand, buy more equipment, hire workers, etc. It hoped to spark a virtuous cycle of more sales, more consumer spending and to revive the moribund real estate market. Moreover, banks could repair their balance sheets with the cheap capital.

Imagine that you are a bank. The Fed tells you that it is lowering short rates and holding them low for a long time. That is, in essence, a signal to borrow short and lend long. In the summer of 2009, T-Bills were yielding roughly 0.5% and 10-year Treasuries were roughly 3.5%. If the bank were to borrow short and lend long with Treasury securities (no credit risk), it could get a spread of roughly 3%. Lever that trade up a “conservative” 10 times and you get a 30% return. 20 times leverages gets you 60% return. Pretty soon, you’ve made a ton of money to repair your balance sheet.

The banks weren’t the only ones playing this game. The hedge funds piled into this trade. Pretty soon, you saw the whole world reaching for yield. The game was to borrow short and lend either long or to lower credits. Carry trades of various flavors exploded. There were currency carry trades, some went into junk bonds, others started buying emerging market paper. You get the idea.

The net effect was that not only interest rates fell, Risk premiums fell across the board. The equity risk premium compressed and the stock market soared. Credit risk premiums narrowed and the price of lower credit bonds boomed.

Managing the exit
During these successive rounds of quantitative easing, analysts started to wonder how the Fed manages to exit from its QE program and ZIRP. We all knew that the day would have to come sooner or later. So on May 22, 2013, Ben Bernanke stated publicly that the Fed was considering scaling back its QE purchases, but such a decision was data dependent.

In other words, it communicated and warned the markets! Consider this 2004 paper by Bernanke, Reinhardt and Sack called Monetary Policy Altnernatives at the Zero Bound: An Empircal Assessment in which the authors discuss the tools that the Fed has available when interest rates are zero or near zero [emphasis added]:

Our results provide some grounds for optimism about the likely efficacy of nonstandard policies. In particular, we confirm a potentially important role for central bank communications to try to shape public expectations of future policy actions. Like Gürkaynak, Sack, and Swanson (2004), we find that the Federal Reserve’s monetary policy decisions have two distinct effects on asset prices. These factors represent, respectively, (1) the unexpected change in the current setting of the federal funds rate, and (2) the change in market expectations about the trajectory of the funds rate over the next year that is not explained by the current policy action. In the United States, the second factor, in particular, appears strongly linked to Fed policy statements, probably reflecting the importance of communication by the central bank. If central bank “talk” affects policy expectations, then policymakers retain some leverage over long-term yields, even if the current policy rate is at or near zero.

The market misses the point
From my read of market commentaries, I believe that analysts are focusing too much on the timing and mechanics of “tapering” and not on the meta-message from the Fed. If quantitative easing is meant to lower interest rates and lower the risk premium, then a withdrawal of QE reverses that process.

In effect, the Fed threw several giant parties. Now it is telling the guests, “If things go as we expect, Last Call will be some time late this year.”

Imagine that you are the bank in the earlier example which bought risk by borrowing short and lending long, or lending to lower credits in order to repair your balance sheet. When the Fed Chair tells you, “Last Call late this year”, do you stick around for Last Call in order to make the last penny? No! The prudent course of action is to unwind your risk-on positions now. We are seeing the start of a new market regime as risk gets re-priced.

That’s the message many analysts missed. The Fed is signaling that risk premiums are not going to get compressed any further. It will now be up to the markets to find the right level for risk premiums.  Watch for Ben Bernanke to elaborate on those issues on Wednesday*. In the July 4 edition of Breakfast with Dave, David Rosenberg wrote the following about the Fed’s communication policy:

I actually give Bernanke full credit for giving the markets a chance to start to price that in ahead of the event, and to re-introduce the notion to the investment class that markets are a two-way bet, not a straight line up. Volatility notwithstanding, I give Berananke an A+ for shaking off the market complacency that came to dominate the market thought process of the first four months of the year (to the point where the bubbleheads on bubblevision were counting consecutive Tuesdays for Dow rallies). Ben’s communication skills may be better than you think – underestimating him may be as wise as underestimating Detective Columbo, who also seems “awkward” but was far from it.

Bernanke knows exactly what he is doing when he hints about tapering in his public remarks. It’s the risk premium, stupid! And it’s going up.

Earnings to do heavy lifting
With this shift in tone, don’t expect the Fed to push yields down anymore. The Fed won’t be pushing you to take as much risk. Consider what this means for stocks. If the economy does truly take off and earnings grow, then stock prices can rise. However, don’t expect stock prices to rise because P/Es are going to go up because the Fed is pushing the market to take more risk. In fact, P/Es are more likely to fall and it will be up the the E component of that ratio, namely earnings, to do the heavy lifting.

As we approach Earnings Season, the task may be more difficult. Thomson-Reuters reports that negative guidance is high compared to recent history:

As the beginning of the second-quarter earnings season approaches, the negative guidance sentiment is weighing on analyst estimates. So far, S+P 500 companies have issued 97 negative earnings preannouncements and only 15 positive ones, for a negative to positive ratio of 6.5. The guidance has contributed to the downward slide in second quarter growth estimates, with EPS currently estimated to grow 3.0%, down from the 8.4% estimate at the beginning of the year.

Analysts have an even bleaker outlook for the top line. After a first quarter when S+P 500 companies reported an aggregate revenue growth rate of 0.0%, the consensus currently calls for 1.8% growth in the second quarter. With revenue growth holding back earnings for the past several quarters, we did an evaluation of company management teams’ outlooks for their revenues. Over the time period evaluated, Q1 2008–present, revenue preannouncements were more balanced than were EPS preannouncements. On average, there were 1.7 negative revenue preannouncements for each positive one. This compares with an N/P ratio of 2.4 for EPS over the same period.

The stock market is facing headwinds. This is a regime shift. Markets generally don’t react well to regime shifts and inflection points like these. Expect volatility and an intensee focus on headlines. The path of least resistance for stock prices, notwithstanding a robust economic recovery, is down.

* Ben Bernanke is expected to take questions after his speech. If anyone who is reading this happens to be there, please ask the following for me: “Mr. Chairman, it appears that the latest round of quantitative easing where the Fed bought Agencies instead of Treasuries was inteneded to narrow the risk premium between the two asset clases. Would it fair to conclude that when the Fed starts to wind down its QE program, risk premiums are expected to widen their natural market determined levels?”

Cam Hui is a portfolio manager at Qwest Investment Fund Management Ltd. (“Qwest”). This article is prepared by Mr. Hui as an outside business activity. As such, Qwest does not review or approve materials presented herein. The opinions and any recommendations expressed in this blog are those of the author and do not reflect the opinions or recommendations of Qwest.

None of the information or opinions expressed in this blog constitutes a solicitation for the purchase or sale of any security or other instrument. Nothing in this article constitutes investment advice and any recommendations that may be contained herein have not been based upon a consideration of the investment objectives, financial situation or particular needs of any specific recipient. Any purchase or sale activity in any securities or other instrument should be based upon your own analysis and conclusions. Past performance is not indicative of future results. Either Qwest or Mr. Hui may hold or control long or short positions in the securities or instruments mentioned. 

Signs of the Apocalypse


Author Cam Hui

Posted: 3 July 2013

I offer these two signs of the Apocalypse without further comment:

Cam Hui is a portfolio manager at Qwest Investment Fund Management Ltd. (“Qwest”). This article is prepared by Mr. Hui as an outside business activity. As such, Qwest does not review or approve materials presented herein. The opinions and any recommendations expressed in this blog are those of the author and do not reflect the opinions or recommendations of Qwest. 


None of the information or opinions expressed in this blog constitutes a solicitation for the purchase or sale of any security or other instrument. Nothing in this article constitutes investment advice and any recommendations that may be contained herein have not been based upon a consideration of the investment objectives, financial situation or particular needs of any specific recipient. Any purchase or sale activity in any securities or other instrument should be based upon your own analysis and conclusions. Past performance is not indicative of future results. Either Qwest or Mr. Hui may hold or control long or short positions in the securities or instruments mentioned. 

QE reversal = Ursa Minor


Author Cam Hui

Posted: 1 July 2013

Since 2008, I have seen various analysts criticizing the Fed, ECB and other central banks for their efforts at quantitative easing and other forms of unconventional monetary policy. These policies have been criticized as less than effective. One such analyst is Stephen Roach, formerly of Morgan Stanley:

While the Fed’s first round of quantitative easing helped to end the financial-market turmoil that occurred in the depths of the recent crisis, two subsequent rounds – including the current, open-ended QE3 – have done little to alleviate the lingering pressure on over-extended American consumers. Indeed, household-sector debt is still in excess of 110% of disposable personal income and the personal saving rate remains below 3%, averages that compare unfavorably with the 75% and 7.9% norms that prevailed, respectively, in the final three decades of the twentieth century.

Now that the Fed is hinting that it is thinking of taking its foot off the accelerator, we are now seeing the reversal of some of the effects of QE – and it’s sent the markets into convulsions. The intention of all these unconventional policies was to bring down interest rates and push the market into taking more risk. As a result, asset prices have soared and risk premiums have shrunk. Just look at this chart from Zero Hedge:

Now that the Fed is hinting that it is thinking about unwinding these programs, which Fed officials have quick to distinguish between taking the foot off the gas (tapering) and stepping on the brakes (tightening), risk premiums have begun to rise and asset prices have fallen. This chart from Gwyn Davies show that, despite Fed officials communications policy, the market has de facto tightened in spite of Federal Reserve actions:

Consider the effects of this reversal:

  • Treasury bond yields have spiked. The Fed’s began with lowering short-term rates, progressed to buying Treasuries further out on the yield curve and finally added agencies to its purchases. Now that the Fed has signaled that it is considering winding down its QE program, Treasury yields have spiked.
  • It has caused carnage in the Eurodollar market. If you hold down short rates and then tell the world that you expect to hold short rates at zero or near zero for a long, long time, it is an invitation to Mr. Market to put on a carry trade – and it did, with leverage. The signal of reversal is causing these carry trades to unwind, the most obvious of which is the “get cheap funding and buy Eurodollar deposits” trade. See Vince Foster’s Minyanville articleBernanke’s Misfired Shot Heard ‘Round the World.
  • Other carry trades like the currency carry trade are being unwound in a disorderly manner.
  • The Fed’s implicit encouragement for the market to take risk pushed funds into junk and emerging market bonds. We have seen how investors reached for yield in the last few years, some of that money made its way into lower quality credits like junk bonds and emerging market bonds. In particular, the emerging market bond market has sold off in a frenzy. In addition, it has caused stress in a number of EM currencies as the market has begun to re-calibrate risk premiums.
  • The market’s reach for yield likely played a role in China’s latest shadow banking bubble and recent liquidity squeeze. Michael Pettisexplained the carry trade this way:

Over the last two years, and especially in 2013, mainland corporations with offshore affiliates had been borrowing money abroad, faking trade invoices to import the money disguised as export revenues, and profitably relending it as Chinese yuan. As China receives more dollars from exports and foreign investment than it spends on imports and Chinese investment abroad, the People’s Bank of China, the central bank, is forced to buy those excess dollars to maintain the value of the yuan. It does this by borrowing yuan in the domestic markets. But because its borrowing cost is greater than the return it receives when it invests those dollars in low-earning U.S. Treasury bonds, the central bank loses money as its reserves expand. Large companies bringing money into the mainland also force the central bank to expand the domestic money supply when it purchases the inflows, expanding the amount of credit in the system.

In May, however, the authorities began clamping down on the fake trade invoices, causing export revenues to decline. Foreign currency inflows into China dried up, as did the liquidity that had accommodated rapid credit growth. The combination of rapidly rising credit and slower growth in the money supply created enormous liquidity strains within the banking system. This is probably what caused last week’s liquidity crunch and this week’s market convulsions.

When Pettis wrote that Chinese companies imported foreign money and engaged in the practice of “profitably relending it as Chinese yuan”, he is referring to injections into China’s shadow banking system, which is really their subprime market. In a separate note, Izabella Kamanska of FT Alphaville also documented analysis from Deutsche’s Bilal Hafeez indicating that the tight USD-CNY relationship was ripe for a carry trade.

  • Tapering talk has devastated the TIPS market. As the market has contemplated the reversal of QE, inflationary expectations have plummeted and so have the price of TIPS. 
  • QE first buoyed commodity prices and now we are seeing the reversal of that trade. Gold and other hard commodities benefited from low and negative real interest rates. Now that we are seeing real interest rates rise (and inflationary expectations fall), commodity prices are getting hammered.
  • Tapering talk has also implicitly hurt Europe. The ECB has been able to stabilize the eurozone with Draghi’s “whatever it takes” remark and the unveiling of its OMT program, which has not been activated yet. Yield spreads of peripheral countries’ bonds against Bunds have narrowed because of the ECB’s threat of action, along with the flood of global liquidity. Now that the flood of global liquidity is starting to recede, the ECB may actually have to resort to OMT, which would cause another round of euro-angst and more risk premium re-calibration.

I’ve probably forgotten or missed out on some other side effects of the various rounds of Fed QE, but you get the idea. Many of these bets were leveraged bets as they were designed to help banks profit and repair their balance sheets, e.g. the Eurodollar carry trade. When these trades unwind, the effects will not a blip, but a tsunami.

All these macro effects are suggesting that we are at the start of a risk re-pricing process that will take months to complete. It will not be friendly to asset prices at all.

Earnings headwinds
In the US, stock prices are starting to face headwinds from a deteriorating earnings outlook. Ed Yardeni documented that while Street earnings estimates continue to rise, forward sales estimates are falling. How long can this divergence continue? Can margins continue to rise?

One way of boosting earnings per share while the sales outlook is punk is to buy back shares. If you reduce the denominator (shares outstanding), earnings can rise (everything else being equal). Bloomberg reported that the level of share buybacks are so high that corporate quality is deteriorating [emphasis added]:

“The trend of improving credit quality has slowed as profits are slowing,” Ben Garber, an economist at Moody’s Analytics in New York, said in a telephone interview. “As the recovery matures, companies are liable to get more aggressive in taking on share buybacks and dividends.”

Rather than using cash to pay down debt, companies in the S+P 500 Index are attempting to boost their share prices by buying back almost $700 billion of stock this year, approaching the 2007 record of $731 billion, said Rob Leiphart, an analyst at equity researcher Birinyi Associates in Westport, Connecticut.

Borrowers controlled by buyout firms are on pace to raise more than $72.7 billion this year through dividends financed by bank loans, surpassing last year’s record of $48.8 billion, according to S+P Capital IQ Leveraged Commentary & Data.

After cutting expenses as much as they could to improve profitability, companies “will need to see further revenue growth to boost earnings from here,” Anthony Valeri, a market strategist in San Diego with LPL Financial Corp., which oversees $350 billion, said in a telephone interview.

The good news: Ursa Minor
All these factors add up to bad news for the stock market. The good news is that any pullback is likely to be relatively minor and the possibility of a market crash is remote. The Fed has made it clear that it continues to be “data sensitive” and will adjust policy as necessary.

Translation: The Bernanke Put still lives.

Relief rally: Mind the gap(s)
My inner investor has already pulled back to a position of defensiveness. My inner trader, on the other hand, is watching the relief rally for an entry point on the short side. I am indebted to Tim Knight for his idea of watching the charts of HYG, JNK and MUB to watch for rallies up to fill the downside gaps. The theory is that stocks often see trading gaps filled after a price reversal, just as we are seeing now. After that, the down trend would continue. Tim Knight put it more colorfully than I ever could:

There are three ETFs I am watching very closely for gap closes. My motivation is twofold: first, I want to short the everloving bejesus out of them once the gaps are filled, and second, it’s going to be my signal to go balls-out shorting the equities in general.

As I write these words, the gaps in HYG, JNK and MUB have been filled. However, my inner trader is not ready to short “the everloving bejesus” out of this market yet. He is more inclined to pivot from a pure US-centric view to a more global macro view of the world and he is watching how the gaps in the ETFs of some of the aforementioned sectors that were affected by the Fed’s QE actions are resolving themselves.

Consider TLT, the long Treasury ETF, which has not rallied sufficiently to fill the (tinted) gap:

DBV, which is the ETF representing the currency carry trade, has seen its gap filled.

The emerging market ETFs have had their gaps either filled or mostly filled. Here is the chart for EM bonds (EMB):

Here is EM equities (EEM):

Here is China (FXI), which has been a focus of the markets in the past couple of weeks:

Commodity ETFs, however, aren’t performing that well and they continue to be in a downtrend without rallying to fill their gaps. Here is DBC, as a representative of the entire commodity complex. DBC violated a key support level and continues to weaken. It has seen no rally attempt to fill in its gap.

Gold (GLD) is one of the ugliest charts of all. Note, however, how it rallied back in April and May to fill in the gap (shown in green) but it continues to weaken and has shown two gaps (in yellow) that have yet to been filled in a relief rally.

The currencies of commodity-linked economies are behaving badly. Here is the Aussie Dollar:

Here is the Canadian Dollar, which is continue to decline with an unfilled gap:

What about Europe? The chart of FEZ representing eurozone equities below shows that while we have seen a minor relief rally, eurozone equities have not rallied up to fill its gap.

Here’s the score. Sectors with filled gaps: 3; unfilled gaps: 2. My inner trader’s conclusion is that the relief rally isn’t quite finished yet. We are likely to see several weeks of volatility before the process is complete before the longer term fundamentals of the recalibration of risk premiums pushes asset prices lower.

Cam Hui is a portfolio manager at Qwest Investment Fund Management Ltd. (“Qwest”). This article is prepared by Mr. Hui as an outside business activity. As such, Qwest does not review or approve materials presented herein. The opinions and any recommendations expressed in this blog are those of the author and do not reflect the opinions or recommendations of Qwest. 
None of the information or opinions expressed in this blog constitutes a solicitation for the purchase or sale of any security or other instrument. Nothing in this article constitutes investment advice and any recommendations that may be contained herein have not been based upon a consideration of the investment objectives, financial situation or particular needs of any specific recipient. Any purchase or sale activity in any securities or other instrument should be based upon your own analysis and conclusions. Past performance is not indicative of future results. Either Qwest or Mr. Hui may hold or control long or short positions in the securities or instruments mentioned. 

The gold bulls’ final defense


Author Cam Hui

Posted: 27 June 2013

OK, so gold had a very ugly day. For some perspective, here is the long-term chart of gold stretching back to the start of the last gold bull:

This precious metal recently dropped through one important uptrend (dotted line). There is, however, one ultimate last line of defense for the gold bulls, which represents the uptrend stretching back to 2001 (solid line). Uptrend support appears to be at roughly $1150.

There are a number of hopeful signs for gold, at least in the short-term. Tim Knight at The Slope of Hope indicated that silver may be forming a bottom at these levels:

As well, Ed Yardeni showed that there is a high level of correlation between gold prices and TIPS:

Here is a short-term chart of GLD and TIP. TIP rallied today, though GLD sold off. This represents a short-term divergence, though minor, that cannot go on forever.

In short, precious metals appear to be setting up for a relief rally at these levels. However, keep an eye on the longer term trend to judge whether the gold bulls’ last stand is successful or not.

Cam Hui is a portfolio manager at Qwest Investment Fund Management Ltd. (“Qwest”). This article is prepared by Mr. Hui as an outside business activity. As such, Qwest does not review or approve materials presented herein. The opinions and any recommendations expressed in this blog are those of the author and do not reflect the opinions or recommendations of Qwest.

None of the information or opinions expressed in this blog constitutes a solicitation for the purchase or sale of any security or other instrument. Nothing in this article constitutes investment advice and any recommendations that may be contained herein have not been based upon a consideration of the investment objectives, financial situation or particular needs of any specific recipient. Any purchase or sale activity in any securities or other instrument should be based upon your own analysis and conclusions. Past performance is not indicative of future results. Either Qwest or Mr. Hui may hold or control long or short positions in the securities or instruments mentioned. 

Watch these lines in the sand!


Author Cam Hui

Posted: 21 June 2013

The fact that the Fed telegraphed its decision to begin tapering QE later this year, assuming that the current trajectory of economic data holds, was not an enormous surprise to me. However, the combination of the Fed decision, bad China data overnight and a liquidity squeeze in China have served to exacerbate the global market selloffs as I write these words.

Is this just a minor correction or the start of something worse? These are some technical lines in the sand that I am watching. First of all, the decline in the SPX has been contained at its 50-day moving average in the recent past. Can support at the 50 dma, which is at about 1618 hold?

As well, bond yields have been spiking in the wake of the FOMC decision. Past surges in 10-year Treasury yields have been contained at about the 2.4% level. Can 2.4% hold?

Bearish trigger in Europe
I have also been relatively constructive on European equities and believe it to be a value play. Despite the negative tone on the markets, eurozone PMIs have surprised on the upside (via Business Insider):

I wrote that past declines in European equities have been contained at its 200 day moving average (see The bear case for equities). Can the 200 dma hold?

Bearish trigger in emerging markets
In China, the combination of poor June flash PMI and a liquidity crunch have served to throw the markets into a tizzy. Zero Hedge reports that overnight repo rates spiked to 25%, which is evocative of the market seizures seen during the Lehman Crisis.

At this point, we don’t know if this credit crunch is deliberate or if the Chinese authorities have lost control of the interbank market (see FT Alphaville discussion). Michael McDonough sounded the alarm about the possible negative effects of this credit crunch on Chinese growth:

Should the Chinese credit crunch get out of control and start to spill over into the global markets, we should see the first signs of it in emerging market bonds. I wrote to watch the relative performance ratio of the emerging market bond ETF (EMB) against US high yield (HYG), which is testing a key relative technical support level (see An EM yellow flag):

I had written in the past to watch the price of the Chinese banks listed in HK as warning signs (see The canaries in the Chinese coalmine). That indicator may have lost some of its power as Reuters reported on Monday that the Chinese authorities have stepped in to increase their stake the state banks in order to “boost confidence”:

China’s government has stepped up efforts to lift confidence in the country’s flagging stock markets by buying more shares in the four biggest commercial banks, stock exchange statements showed on Monday.

Central Huijin Investment Co, which holds Beijing’s investments in state-owned financial firms, spent about 363 million yuan ($59.2 million) buying bank shares on June 13, Reuters calculations based on stock exchange filings showed.

This is the third time Huijin has been known to be buying shares in the secondary market since June 13, when China’s stock market skidded to six-month lows after data showed the world’s second-biggest economy was cooling faster than expected.

Watch the tripwires!
In summary, I wrote on Monday that my Trend Model had moved to “neutral” from “risk-on” (see Is the correction over?). For now, I am in watch and wait mode and monitoring these bearish tripwires before I go into full-flown “risk-off” mode:

  • Can the 50 dma hold for the SPX?
  • Can the 10-year Treasury yield breach the 2.4% level?
  • Can decline in the STOXX 600 be arrested at the 200 dma?
  • Will emerging market bonds melt down?

Cam Hui is a portfolio manager at Qwest Investment Fund Management Ltd. (“Qwest”). This article is prepared by Mr. Hui as an outside business activity. As such, Qwest does not review or approve materials presented herein. The opinions and any recommendations expressed in this blog are those of the author and do not reflect the opinions or recommendations of Qwest. 

None of the information or opinions expressed in this blog constitutes a solicitation for the purchase or sale of any security or other instrument. Nothing in this article constitutes investment advice and any recommendations that may be contained herein have not been based upon a consideration of the investment objectives, financial situation or particular needs of any specific recipient. Any purchase or sale activity in any securities or other instrument should be based upon your own analysis and conclusions. Past performance is not indicative of future results. Either Qwest or Mr. Hui may hold or control long or short positions in the securities or instruments mentioned. 

Passing the generational torch


Author Cam Hui

Posted: 21 June 2013

As I watched the Audi commercial of Zachary Quinto (new Spock) vs. Leonard Nimoy (old Spock) (via Barry Ritholz), I am reminded of the issues surrounding the process of passing on the torch from one generation to the next and how it affects the financial services business. A research report from Pershing LLC showed that financial advisors are potentially leaving a lot of money on the table by ignoring their clients’ children:

Some $30 trillion in assets is expected to be shifted to younger generations over the next 30 years, according to Pershing LLC, a subsidiary of Bank of New York Mellon. And advisers typically lose half of the assets they manage when those assets are passed from one generation to the next, a 2011 study by consulting firm PriceWaterhouse Coopers found.

In a survey of 317 advisers conducted in February and March, Pershing found that more than half of their affluent clients had adult children, but advisers had talked about finances with only about a third of those children.

Advisers who don’t want to lose those assets should get up to speed on how to win the next generation. The basics: Attract them with engaging events and modern practice-management methods, then retain them with solid financial planning.

The suggested solution is to spend time wooing the kids:

You can start by coordinating a family meeting so your clients can introduce you to their children. Make estate planning the focus so you can explore the family’s expectations for their wealth – and try to ferret out situations where the parents and the children might have different financial objectives that could complicate your serving both of them at the same time.

Offer to provide complimentary financial planning to your clients’ children. These accounts won’t pay big, but the parents will appreciate it. Then hand off those accounts to younger advisers in your office. Not only will this be good practice for them, they’ll probably be better at relating to the younger clients.

Focus more on the needs of Gen X and Millennials by “Remodeling for a hipper look”:

Consider making over your office to make it more appealing to the next generation, said Wayne Badorf of Wells Fargo Asset Management, a practice-management expert. Put a few magazine-loaded iPads in the lobby, install Wifi and add energy drinks to your complimentary beverages.

You may need to revamp your online image. As long as your compliance officer approves, use your site to link to financial podcasts and interesting websites. And make it a portal for clients to access their statements and make updates to accounts.

Overly conventional thinking
I believe that such approaches are likely to yield disappointing results. When I speak to affluent Baby Boomers, their fears are that their children will not have the tools to properly manage their wealth. Their darkest fear is their kids acquire the Paris Hilton syndrome. A common refrain is, “What happens when my twentysomething son/daughter gets this [six or seven figure] windfall drop in their laps?”

Indeed, the SEC found that financial literacy is a serious issue amongst Americans. A Dodd-Frank-mandated study of financial literacy and concluded that Americans have a low level of financial literacy:

Studies reviewed by the Library of Congress indicate that U.S. retail investors lack basic financial literacy. The studies demonstrate that investors have a weak grasp of elementary financial concepts and lack critical knowledge of ways to avoid investment fraud.

2009 FINRA study found that investors way over-estimated their own financial knowledge. They were fairly confident about their own abilities, but when asked some basic financial concepts, their understanding was appalling lacking. Here are the questions, which shouldn’t be that difficult for anyone who has some basic financial understanding:

  1. Imagine that the interest rate on your savings account was 1% a year and inflation was 2% a year. After one year, how much would be able to buy with the money in this account? [More|Less] (64% correct)
  2. If interest rates rise, what will typically happen to bond prices? (21% correct)
  3. Supposing that you had $100 in a savings account and the interest rate was 2% per year. After five years, how much do you think you would have in the account if you left the money to grow? [More than $102|Less than $102] (65% correct)
  4. A 15-year mortgage typically requires higher monthly payments than a 30-year mortgage, but the total interest paid over the life of the loan will be less. [True|False] (70% correct)
  5. Buying a single company’s stock usually provides a safer return than a stock mutual fund. [True|False] (52% correct)

Financial literacy + Instilling passion = Value creation
There is a silver lining in this dark cloud. The FINRA study showed that higher income groups were more financially literate than the general population. Nevertheless, I believe that the road to recruiting the next generation of clients is involves a dual-track approach of financial education and instilling a passion for creating wealth. The latter is important because it shifts the attitude of the next generation from viewing the inheritance as consumption (the Paris Hilton symdrome) to wealth generation.

Katherine Lintz of Financial Management Partners seems to have hit the right notes in her approach, according to this Bloomberg report:

They call it “money camp.” Twice a week, 6- to 11-year-old scions of wealthy families take classes on being rich. They compete to corner commodities markets in Pit, the raucous Parker Brothers card game, and take part in a workshop called “business in a box,” examining products that aren’t obvious gold mines, such as the packaging on Apple Inc.’s iPhone rather than the phone itself.

The results have been astounding:

Lintz, 58, is on to something. Her 22-year-old firm was No. 2 among the fastest-growing multifamily offices in the second annual Bloomberg Markets ranking of companies that manage affairs for dynastic clans, Bloomberg Markets magazine reports in its September issue. The assets that FMP supervises grew 30 percent to $2.6 billion as of Dec. 31, just behind Signature, a Norfolk, Virginia-based family office that expanded 36 percent in 2011 to $3.6 billion.

I believe that Lintz has found a formula that many financial advisory firms catering to the HNW market has ignored or didn’t know how to approach – the issue of how to recruit the next generation of clients. By combining financial literacy education and an approach that instills a passion for creating wealth, her firm has made its AUM much stickier and fashioned an important tool to recruit older clients who are concerned about these issues of how to pass the family torch.

Investment firms, analysts and advisors spend a lot of time talking and thinking about how companies create value. This is one way of how investment firms can create values for themselves.

Cam Hui is a portfolio manager at Qwest Investment Fund Management Ltd. (“Qwest”). This article is prepared by Mr. Hui as an outside business activity. As such, Qwest does not review or approve materials presented herein. The opinions and any recommendations expressed in this blog are those of the author and do not reflect the opinions or recommendations of Qwest. 

None of the information or opinions expressed in this blog constitutes a solicitation for the purchase or sale of any security or other instrument. Nothing in this article constitutes investment advice and any recommendations that may be contained herein have not been based upon a consideration of the investment objectives, financial situation or particular needs of any specific recipient. Any purchase or sale activity in any securities or other instrument should be based upon your own analysis and conclusions. Past performance is not indicative of future results. Either Qwest or Mr. Hui may hold or control long or short positions in the securities or instruments mentioned. 

The bear case for equities


Author Cam Hui

Posted: 11 June 2013

I have been fairly bullish in these pages and I remain cautiously bullish today. However, successful investors and traders look at the other side of the coin to see what could go wrong with their thesis. Today, I write about the bear case, or what’s keeping me up at night.

The signal from emerging market bonds
James Carville, former advisor to Bill Clinton, famously said that he wanted to be reincarnated as the bond market so that he could intimidate everyone. The message from the bond market is potentially worrying. In particular, emerging market bonds are selling off big time. The chart below of the emerging market bond ETF (EMB) against the 7-10 year Treasury ETF tells the story. The EMB/IEF ratio broke an important relative support level, with little signs of any further support below the break.

Technical breaks like these are sometime precursors of a catastrophic event, much like how the crisis in Thailand led to the Asian Crisis. For now, the concerns are somewhat “contained”. Yes, junk bond yileds have spiked…

On the other hand, the relative performance of high yield, or junk, bonds against 7-10 year Treasuries remain in a relative uptrend, which indicates that the trouble remains isolated in emerging markets.

Here is the relative performance of emerging market bonds against junk bonds. They have been in a multi-year trading range. Should this ratio break to the downside, it would be an indication that something is seriously wrong in EM that smart investors would be well advised to sit up and take notice of.

For now, this is just something to watch.

Are European stocks keeling over?
The second area of concern is Europe. Despite my bullish call on Europe (see Europe healing?) European stocks have been performing poorly in this correction. As the chart below of the STOXX 600 shows, the index has fallen below its 50 day moving average, though the 200 day moving average has been a source of support in the past.

The 200 dma is my line in the sand.

Faltering sales and earnings momentum
In the US, high frequency macro indicators are showing a pattern of more misses than beats, as measured by the Citigroup Economic Surprise Index.

Ultimately, a declining macro outlook will feed into Street sales and earnings expectations for the stock market. Ed Yardeni documented the close correlation between the Purchasing Managers Index against revenue estimates.

Viewed in this context, the PMI “miss” last week is especially worrying. Indeed, Yardeni showed that the Street’s forward 52-week revenue estimates are now ticking down. Unless margins were to expand, which is unlikely, earning estimates will follow a downward path and provide a headwind for equity prices.

As Zero Hedge aptly puts it, this is what you would believe if you were buying stocks right now:

My take is that the downturn in high frequency economic releases a concern, but it is something to watch and it’s not quite time to hit the panic button yet. I agree with New deal democrat in his weekly review [emphasis added]:

After several weeks of more positive signs, last week we returned to the pattern of gradual deterioration that began in February. This week most indicators remain positive and there were fewer negatives…

Last week I said that for me to be sold that the data is actually rolling over, I would want to see a sustained increase in jobless claims and a sustained deterioration in consumer spending. That wasn’t happening as of last week, and it certainly didn’t happen this week either. The economy still seems to be moving forward – but in first gear.

In summary, most of these concerns are on the “something to watch” list to see if any of these risks turn out to be more serious. My base case, for now, is that the market is undergoing a typical rolling correction, with leadership shifting from interest sensitive issues to deep cyclicals (see my recent postCommodities poised for revival). Until the late cycle commodity stocks roll over, there is probably more upside to stocks from these levels, but I am still looking over my shoulder and defining my risk parameters carefully.

Cam Hui is a portfolio manager at Qwest Investment Fund Management Ltd. (“Qwest”). This article is prepared by Mr. Hui as an outside business activity. As such, Qwest does not review or approve materials presented herein. The opinions and any recommendations expressed in this blog are those of the author and do not reflect the opinions or recommendations of Qwest. 

None of the information or opinions expressed in this blog constitutes a solicitation for the purchase or sale of any security or other instrument. Nothing in this article constitutes investment advice and any recommendations that may be contained herein have not been based upon a consideration of the investment objectives, financial situation or particular needs of any specific recipient. Any purchase or sale activity in any securities or other instrument should be based upon your own analysis and conclusions. Past performance is not indicative of future results. Either Qwest or Mr. Hui may hold or control long or short positions in the securities or instruments mentioned.