Should you have sold in May?


Author Cam Hui

Posted: 04 Jun 2013

All it took was someone to whisper “Fed tapering” and volatility has returned with a vengeance to the markets. I explored this topic in late April (see Sell in May?) and outlined various criteria for getting bearish. For now, most of them haven’t been met, which means that I am still inclined to give the bull case the benefit of the doubt.

Surveying the Big Three global economies (US, Europe and China), I see signs of healing – which suggest that markets are likely to continue to grind higher, albeit in a volatile fashion. Let’s take the regions one by one.

US: Muddling through
As I mentioned, I outlined a number of bearish tripwires in my previous post Sell in May?

  • Earnings getting revised downwards, or more misses in earnings reports;
  • More misses in the high frequency economic releases;
  • Major averages to decline below their 50 dma; and
  • Failure of cyclical sectors to regain their leadership and defensive sectors to outperform.

With the exception of high frequency economic release data, none of the aforementioned tripwires have been triggered. The chart below shows the decline in the Citigroup Economic Surprise Index, but my own personal impression of high frequency economic data is that the results have been mixed. Even then, bad news may be good news as a weakening economy may provide the impetus for the Federal Reserve to delay any tapering of QE-infinity.

We will have a major test of market psychology this Friday. Supposing that the Non-Farm Payroll misses expectations, will the markets react positively because it is another data point supportive of further QE, or negatively because employment isn’t growing as expected?

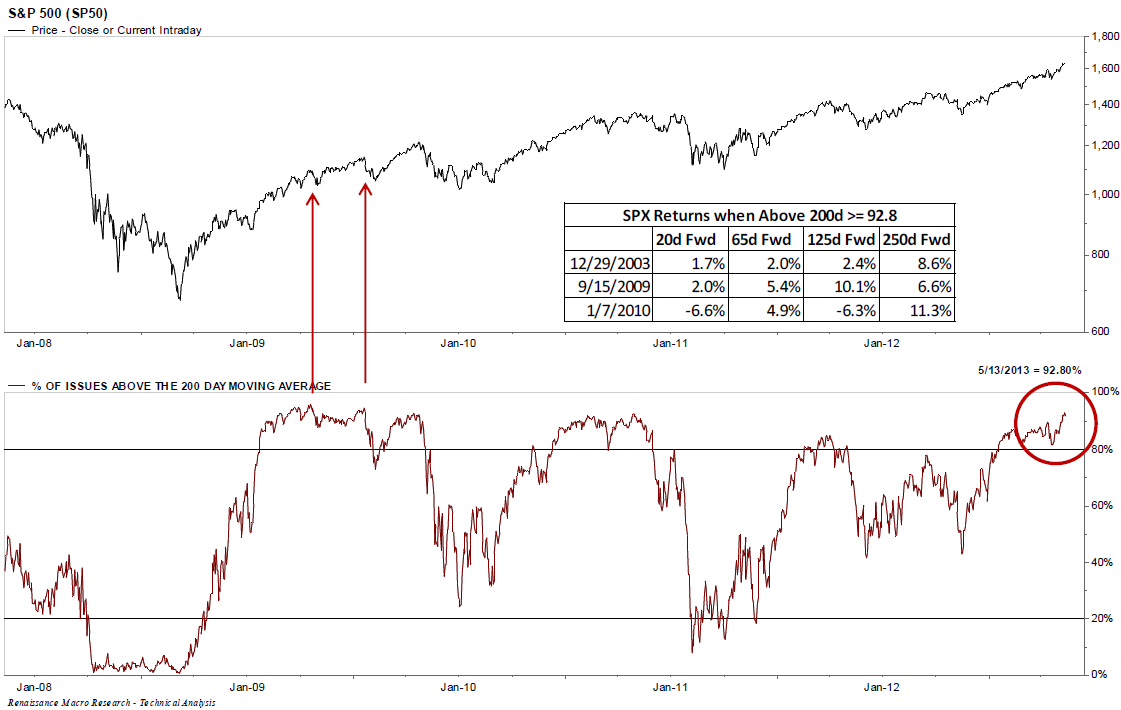
In the meantime, the major market averages remain in a well-defined uptrend. So why are traders so skittish?

In fact, market participants have been so skittish that it only took a minor decline in the major averages for the percentage of bulls from the AAII survey to tank from a crowded long reading (chart via Bespoke). This kind of nervousness do not typically mark major market tops.

In late April, I also wrote that the bearish case also depended on the continued leadership of the defensive sectors and for cyclical sectors to continue to underperform. Well, those trends reversed themselves dramatically in the month of May. The relative performance chart below of Utilities (XLU) and REITs (VNQ) against the market shows that defensive and yield related sectors took a huge hit in the month:

Meanwhile, cyclical sectors as measured by the Morgan Stanley Cyclical Index have started to turn up against the market. What’s more telling is the fact that cyclical sectors performed well in Friday’s market selloff.

Europe: The next step in the Grand Plan
Across the Atlantic, I am seeing signs of healing in Europe (see Europe healing?) What’s more important is the fact that eurozone leaders are taking steps beyond pure austerity measures to address their structural problems.

Recall during the eurozone crises, many analysts said that there were only two solutions to eurozone problems, which was a competitiveness gap between the North and South. Either Greece (or insert the peripheral country of your choice here) leaves the euro and devalues to regain competitiveness, or the North (read: Germany) makes an explicit political decision to subsidize the South. It appears that the latter is happening (from The Guardian) and the focus issue is youth unemployment:

The French, German and Italian governments joined forces to launch initiatives to “rescue an entire generation” who fear they will never find jobs. More than 7.5 million young Europeans aged between 15 and 24 are not in employment, education or training, according to EU data. The rate of youth unemployment is more than double that for adults, and more than half of young people in Greece (59%) and Spain (55%) are unemployed.

Der Spiegel echoed the German “party line” about youth unemployment:

But a new way of thinking has recently taken hold in the German capital. In light of record new unemployment figures among young people, even the intransigent Germans now realize that action is needed. “If we don’t act now, we risk losing an entire generation in Southern Europe,” say people close to Schäuble.

The new solution is now direct country-to-country assistance instead of assistance through the usual EU institutions [emphasis added]:

To come to grips with the problem, Merkel and Schäuble are willing to abandon ironclad tenets of their current bailout philosophy. In the future, they intend to provide direct assistance to select crisis-ridden countries instead of waiting for other countries to join in or for the European Commission to take the lead. To do so, they are even willing to send more money from Germany to the troubled regions and incorporate new guarantees into the federal budget. “We want to show that we’re not just the world’s best savers,” says a Schäuble confidant.

The initial focus of the direct assistance is Spain:

Last Tuesday, Schäuble sent a letter to Economics Minister Philipp Rösler in which he proposed that the coalition partners act together. “I believe that we should also offer bilateral German aid,” he wrote, noting that he hoped that this approach would result in “significant faster-acting support with visible and psychologically effective results within a foreseeable time period.”

Schäuble needs Rösler’s cooperation because the finance and economics ministries are jointly responsible for the government-owned KfW development bank. The Frankfurt-based institution is to play a key role in the German growth concept that experts from both ministries have started drafting for Spain. Spanish companies suffer from the fact that the country’s banks are currently lending at only relatively high interest rates. But since it is owned by the German government, the KfW can borrow money at rates almost as low as the government itself. Under the Berlin plan, the KfW would pass on part of this benefit to the ailing Spanish economy.

This is how the plan is supposed to work: First, the KfW would issue a so-called global loan to its Spanish sister bank, the ICO. These funds would then enable the Spanish development bank to offer lower-interest loans to domestic companies. As a result, Spanish companies would be able to benefit from low interest rates available in Germany.

The concerns over youth unemployment isn’t new. ECB head Mario Draghi spoke about the structural problems relating to youth unemployment in early 2012 (see Mario Draghi reveals the Grand Plan). In a WSJ interview, Draghi discussed what he believed it took to solve the youth unemployment problem [emphasis added]:

WSJ: Which do you think are the most important structural reforms?

Draghi: In Europe first is the product and services markets reform. And the second is the labour market reform which takes different shapes in different countries. In some of them one has to make labour markets more flexible and also fairer than they are today. In these countries there is a dual labour market: highly flexible for the young part of the population where labour contracts are three-month, six-month contracts that may be renewed for years. The same labour market is highly inflexible for the protected part of the population where salaries follow seniority rather than productivity. In a sense labour markets at the present time are unfair in such a setting because they put all the weight of flexibility on the young part of the population.

The first step in the Grand Plan was to gradually go after all the entrenched interests of people with lifetime employment and their gold-plated pension plans, etc. In other words, get rid of the European social model:

WSJ: Do you think Europe will become less of the social model that has defined it?

Draghi: The European social model has already gone when we see the youth unemployment rates prevailing in some countries. These reforms are necessary to increase employment, especially youth employment, and therefore expenditure and consumption.

WSJ: Job for life…

Draghi: You know there was a time when (economist) Rudi Dornbusch used to say that the Europeans are so rich they can afford to pay everybody for not working. That’s gone.

Now that they are taking steps to clean out the deadwood, the next thing to do is to plant, i.e. directly address the youth unemployment problem. These are all positive structural steps and, if properly implemented, result in a new sustainable growth model for Europe.

In the meantime, the Euro STOXX 50 staged an upside breakout in early May and, despite the recent pullback, the breakout is holding:

Stabilization in China
The bear case for China is this: The leadership recognizes that the model of relying on infrastructure spending and exports to fuel growth is unsustainable. It is trying to wean the economy off that growth path and shift it to one fueled by the Chinese consumer. Moreover, it has made it clear that given a choice between growth and financial stability, the government will choose the latter. This was a signal that we shouldn’t expect a knee-jerk response of more stimulus programs should economic growth start to slow down.

Indeed, growth has slowed as a result. The non-consensus call I recently wrote about is that China seems to showing signs of stabilization (see Even China join the bulls’ party). Since that post, further signs of stabilization is also coming from direct and indirect indicators of Chinese growth.   First and foremost, China’s PMI came out late Friday and it beat expectations (from Bloomberg):

China’s manufacturing unexpectedly accelerated in May, indicating that a slowdown in economic growth in the first quarter may be stabilizing.

The Purchasing Managers’ Index rose to 50.8 from 50.6 in April, the National Bureau of Statistics and China Federation of Logistics and Purchasing said in Beijing yesterday. That was higher than all estimates in a Bloomberg News survey of 30 analysts and compares with the median projection of 50, which marks the dividing line between expansion and contraction.

Moreover, the KOSPI in nearby South Korea, which exports much capital equipment into China, is behaving well. This is somewhat surprising as South Korea competes directly with Japan and the deflating Japanese Yen is undoubtedly putting considerable pressure on the competitiveness of Korean exports:

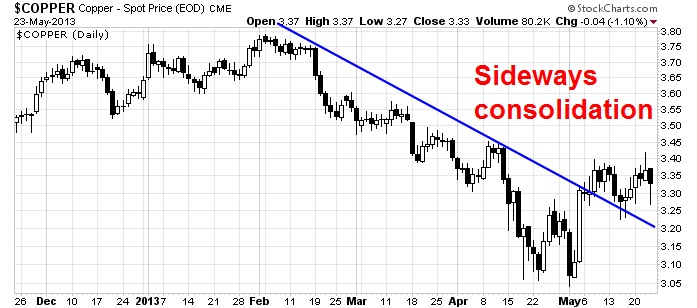
Other indirect indicators of Chinese demand such as commodity prices are stabilizaing. Dr. Copper rallied out of a downtrend and appears to be undergoing a period of sideways consolidation.

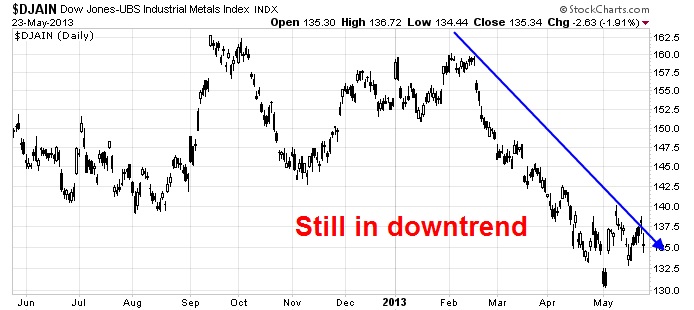
A similar pattern can be seen in the industrial metal complex:

Oil prices, as measured by Brent (the real global price), is also trying to stabilize:

Key risks
In summary, the overall picture seems to be one of stabilization and recovery around the world. In such an environment, stock prices can continue to move higher in a choppy fashion. There are, however, a number of key risks to my outlook:

  • US macro surprise: If we get an ugly NFP this Friday and further signs that US macro picture is slowing, it will negatively affect the earnings outlook and deflate stock prices.
  • Japan: John Mauldin has a succinct summary of the issues facing Japan that I won’t repeat but you should read (see Central Bankers gone wild). The issue of a blowup seems to be one of timing and a catastrophic outcome could be close at hand. With bond yields spiking, how will the economy adjust to rising rates? Already, Toyota has pulled a bond issue because of rising rates. Zero Hedge pointed out how JPM has postulated that “a 100bp interest rate shock in the JGB yield curve, would cause a loss of ¥10tr for Japan’s banks”:

The rise in JGB volatility is raising concerns about a volatility-induced selloff similar to the so called “VaR shock” of the summer of 2003. At the time, the 10y JGB yield tripled from 0.5% in June 2003 to 1.6% in September 2003. The 60-day standard deviation of the daily changes in the 10y JGB yield jumped from 2bp per day to more than 7bp per day over the same period.
As documented widely in the literature, the sharp rise in market volatility in the summer of 2003 induced Japanese banks to sell government bonds as the Value-at-Risk exceeded their limits. This volatility induced selloff became self-reinforcing until yields rose to a level that induced buying by VaR insensitive investors.

  • An emerging market blowup and subsequent financial contagion: The hints of Fed tapering have negatively affected the emerging market bond market and they are starting to roll over against Treasuries. I am monitoring this chart of emerging market bonds against 7-10 Treasuries carefully for signs of market stress and contagion.

The Short Side of Long has indicated that, in general, sentiment towards equities remain at frothy levels which suggests that a short-term pullback may be in order, However,  I am still inclined to stay long equities on an intermediate term basis and give the bulls the benefit of the doubt, but at the same time watching over my shoulder for signs of trouble.

Cam Hui is a portfolio manager at Qwest Investment Fund Management Ltd. (“Qwest”). This article is prepared by Mr. Hui as an outside business activity. As such, Qwest does not review or approve materials presented herein. The opinions and any recommendations expressed in this blog are those of the author and do not reflect the opinions or recommendations of Qwest. 

None of the information or opinions expressed in this blog constitutes a solicitation for the purchase or sale of any security or other instrument. Nothing in this article constitutes investment advice and any recommendations that may be contained herein have not been based upon a consideration of the investment objectives, financial situation or particular needs of any specific recipient. Any purchase or sale activity in any securities or other instrument should be based upon your own analysis and conclusions. Past performance is not indicative of future results. Either Qwest or Mr. Hui may hold or control long or short positions in the securities or instruments mentioned.

Giving the bulls the benefit of the doubt


Author Cam Hui

Posted: 25 May 2013

OK, I was partially right. On Monday, I wrote that commodities were setting up for a rebound (see Commodities poised to rally?):

All of these conditions are lining up to suggest that commodities are poised to rebound. The euro, commodity sensitive currencies and gold are all at key technical support levels. As I write these words, precious metal prices are substantially in the red. Watch for signs of stabilization, or better yet, reversal on the day. If that were to happen, expect that the rotation back into cyclical sectors will continue and stock prices to continue to grind higher.

I was partly right. Gold appears to be turning around here, though it is more correlated with the safety trade than the risk trade. The chart of GLD below shows a constructive bottoming process, with overhead resistance at about the 150 level.

On the other hand, the rotation into deep cyclicals hasn’t fully developed yet. Consider copper as an example. The red metal has rallied through a downtrend and seems to be consolidating sideways. 

Other industrial metals remain in a downtrend, though.

And oil prices, as measured by Brent global oil price benchmark, are still in a downtrend and has not participated yet in a commodity upswing.

Though natural gas seems to march to beat of its own drummer as it staged an upside breakout, driven by positive fundamentals.

I remain constructive on the rotation into the deep cyclicals. Despite the market’s freakout over Bernanke’s off the cuff remarks* about the possibility that the pace of QE might be tapered, followed by a poor HSBC manufacturing PMI out of China and Japanese stocks cratering by 7% (though they are recovering as I write these words), the technicals for the cyclical trade looks intact.   Consider this relative performance chart of the Morgan Stanley Cyclical Index (CYC) against the market. These stocks held up well in light of the mini-panic over the last couple of days.

Joe Fahny wrote that he is seeing very jittery traders and signs of panic, which suggests to me that any pullback is likely to be short-lived: 

Today is May 22, 2013. The general market declined by less than 1% (0.82% to be exact) and my phone has been blowing up with panic by people who are IN the market!!! My trading friends are either calling or texting me with serious worry, and even a few stories of mini “blow-ups” today. I’ve never seen anything like this in my 17 year career! God help these people when (not if) we get a serious correction.

As well, Barry Ritholz pointed out this piece of analysis from Jeff deGraaf [emphasis added]:

Jeff deGraaf, technician extraordinaire (formerly of Lehman now at Renaissance Macro Research) makes an interesting observation about the heavily overbought markets.

Last week, the S&P500 had ~93% of all stocks trading over their 200 day moving average. Normally, this degree of overbought should lead to a correction. As you can see in the inset box, it sometimes does. 

However, if you are looking out a year, we see that over the past 3 instances, markets have been higher.

Is the market overbought? Yes. But these conditions constitute what my former Merrill Lynch colleague Walter Murphy termed a “good overbought” condition.

I am inclined to give the bull case the benefit of the doubt for now, though I am maintaining a risk control discipline of tight and trailing stops.

* Paul Volcker once remarked that as Fed Chairman, he was so guarded about his public remarks that if he went to a restaurant, he would say, “I’ll have the steak, but that doesn’t mean that I don’t like the chicken or the lobster.”

Cam Hui is a portfolio manager at Qwest Investment Fund Management Ltd. (“Qwest”). This article is prepared by Mr. Hui as an outside business activity. As such, Qwest does not review or approve materials presented herein. The opinions and any recommendations expressed in this blog are those of the author and do not reflect the opinions or recommendations of Qwest.

None of the information or opinions expressed in this blog constitutes a solicitation for the purchase or sale of any security or other instrument. Nothing in this article constitutes investment advice and any recommendations that may be contained herein have not been based upon a consideration of the investment objectives, financial situation or particular needs of any specific recipient. Any purchase or sale activity in any securities or other instrument should be based upon your own analysis and conclusions. Past performance is not indicative of future results. Either Qwest or Mr. Hui may hold or control long or short positions in the securities or instruments mentioned.

Something’s not right about this rally


Author Cam Hui

Posted: 2 Apr 2013

OK, so the SPX made a new high. Many of my momentum models are bullish, but my relative strength work (see my previous post on combining momentum with trend following techniques) is making me scratch my head.

To explain, my work based on a paper by a team of researchers at Cass Business School entitled The Trend is Our Friend: Risk Parity, Momentum and Trend Following in Global Asset Allocation suggests that when the market is experiencing an uptrend, you should go for broke and buy the “hot” sectors of the day. On the other hand, when the market is falling, buying the “hot” sectors is a recipe for disaster.

A risk friendly market trend
First of all, my trend following and momentum models is pointing to a risk-on market. Consider the relative returns of SPY (stocks) against IEF (7-10 year Treasuries) below. Unquestionably, we are seeing an uptrend in the risk trade:

The risk-on trade isn’t just restricted to stocks vs. bonds. The same effect could be seen in the credit market, where junk bonds are outperforming:

Defensive leadership
Here is what’s bothering me. We are obviously seeing an uptrend in the stock market, as evidenced by the new highs. However, sector leadership is gradually shifting away cyclical sectors to defensive sectors and industries. Take a look at what the leadership is today.

The chart below shows the relative returns of Financials (XLF) against the market (SPY). Financials are in a well-defined relative uptrend against the market.

Here are the Transportation stocks, which is a small cyclically oriented industry. These stocks are also in a well-defined relative uptrend.

OK. So far so good. Now here comes the surprises. Look at the relative strength in Healthcare:

…and the turnaround in the relative strength of Utilities:

Commodity cyclicals lagging
I have written that cyclical sectors are displaying a pattern of relative sideways consolidation after an uptrend (see An uncomfortable bull). I won’t repeat myself, but you can click on the link and see the charts there.

What’s bothering me is that commodity related sectors are lagging badly. Consider the equal-weighted Continuous Commodity Index, which is in a minor downtrend. Though it doesn’t seem disastrous and commodity prices have firmed somewhat in the past three weeks, the price action of the commodity complex is not exactly signaling a robust global recovery.

On the other hand, the price action of industrial metals look downright ugly.

Here are some price relative charts of commodity sensitive stock markets against ACWI, or the MSCI All-Country World Index. Australia looks ok, but it’s the exception.

Canada, on the other hand, is in a relative downtrend and has been underperforming since last November.

Here is Brazil. Enough said here:

Here is the relative chart of South Africa (in black), though its relative performance may be linked to the relative performance of gold stocks (in orange):

The relative performance of the cyclically sensitive South Korean market is not exactly inspiring either. South Korea remains in a relative downtrend, though it has staged a relative rally in the last week or so.

What’s going on?
Frankly, I am puzzled by the nature of the sector leadership when the market is making new highs. My momentum and trend following models are telling to stay long. My relative strength models are telling me to rotate into defensive sectors like Utilities and Healthcare. When I net this all out, I wind up in a fairly neutral position.

Something’s not right about this rally. Mohamed El-Arian of Pimco pretty much said the same thing when he indicated that the Markets are sending unusual signals [emphasis added]:

The rally reflects slowly-improving economic conditions, relatively robust corporate profitability and anticipation of stronger domestic and foreign inflows into the equity market. Yet this is far from the whole story.

Investors need only look at where some other benchmarks ended the quarter to get a feel for the unprecedented and artificial nature of today’s capital markets.

Few would have predicted that the impressive equity performance would be accompanied by a 10-year U.S. Treasury rate as low as 1.85 percent, a 10-year German government bond (bund) rate as low as 1.29 percent and gold as high as $1,596 an ounce. Think of this as the markets’ way to signal to investors some key issues for the quarters ahead.

More on this topic in subsequent posts.

Cam Hui is a portfolio manager at Qwest Investment Fund Management Ltd. (“Qwest”). This article is prepared by Mr. Hui as an outside business activity. As such, Qwest does not review or approve materials presented herein. The opinions and any recommendations expressed in this blog are those of the author and do not reflect the opinions or recommendations of Qwest.

None of the information or opinions expressed in this blog constitutes a solicitation for the purchase or sale of any security or other instrument. Nothing in this article constitutes investment advice and any recommendations that may be contained herein have not been based upon a consideration of the investment objectives, financial situation or particular needs of any specific recipient. Any purchase or sale activity in any securities or other instrument should be based upon your own analysis and conclusions. Past performance is not indicative of future results. Either Qwest or Mr. Hui may hold or control long or short positions in the securities or instruments mentioned.

An uncomfortable bull


Author Cam Hui

Posted: 25 Mar 2013

I suppose that I should be happy. I correctly turned bullish on a tactical basis (see Give in to the Dark Side). I correctly called the Cyprus mini-crisis (see Don’t get too excited about Cyprus and More of the usual Eurocrisis drama). As I write these words, the news of the Cyprus deal is sparking a modest risk-on rally.

Over here on this side of the Atlantic, the American economy continues to chug along, despite the sequester and payroll tax hike. I agree with Tim Duy when he writes that the recovery is real.

Sector performance signal caution
When I reviewed my charts on the weekend, I came away vaguely dissatisfied. The relative performance of industries and sectors reveal a market whose leadership that is increasingly turning away from cyclical groups and toward defensive sectors and a “negative beta” group.

If we are seeing such a bullish outlook (Europe, US economy), why are cyclically sensitive sectors not doing better. Consider the relative performance of Consumer Discretionary stocks against the market. This sector is currently seeing a sideways consolidation after stalling out of a relative uptrend that began last August.

Industrials are also displaying a similar pattern as Consumer Discretionary stocks: Stalling out of a relative uptrend followed by sideways consolidation:

The same could be said of homebuilding stocks:

The only cyclically sensitive group that I could find that is still in a relative uptrend against the market are the transportation stocks, which is a relatively narrow group:

Defensive sectors taking the lead
On the other hand, defensive sectors are starting to take the leadership position. Why are they outperforming when the stock market is advancing?

Consider, as an example, the relative performance of Consumer Staples, which is staging a relative strength rally:

Health Care, another sector thought to be defensive in nature, is already in a shallow, but well-defined relative uptrend after staging an upside breakout through relative resistance:

Utilities are forming a relative saucer bottom against the market:

Golds: The negative beta play
What’s more, gold stocks are showing signs of revival. The Amex Gold Bugs Index has rallied through a relative downtrend line against the market, though the longer term relative downtrend (dotted line) remains intact:

HUI has already staged a relative turnaround against bullion as it has strengthened through the relative downtrend against gold.

Gold and gold stocks have somewhat defensive characteristics as they have had a zero or negative correlation against the SPX in recent weeks. Their revival could be a warning sign for stock bulls.

Be very, very careful out there
As I wrote in my recent post Give in to the Dark Side, my inner investor was already skeptical about this most recent rally:

My inner investor continues to be concerned about this market advance. He believes that the prudent course of action would be to move his portfolio asset allocation to its policy weight, i.e. if the policy weight is 60% stocks and 40% bonds, then the portfolio should be at 60/40.

At the time, my inner trader wanted to throw caution to the winds and get long the market. Now, my inner investor is telling him, “I told you so.” Under these circumstances, my inner trader is getting very, very nervous and he is tightening up his trailing stops. The behavior of these sectors is flashing warning signals that if even if this market were to rally further, the advance could be very choppy.

Until we see some evidence of upside relative breakouts of consolidation ranges in cyclical sectors and industries, these market internals should make anyone who is bullish an uncomfortable bull.

Cam Hui is a portfolio manager at Qwest Investment Fund Management Ltd. (“Qwest”). This article is prepared by Mr. Hui as an outside business activity. As such, Qwest does not review or approve materials presented herein. The opinions and any recommendations expressed in this blog are those of the author and do not reflect the opinions or recommendations of Qwest.

None of the information or opinions expressed in this blog constitutes a solicitation for the purchase or sale of any security or other instrument. Nothing in this article constitutes investment advice and any recommendations that may be contained herein have not been based upon a consideration of the investment objectives, financial situation or particular needs of any specific recipient. Any purchase or sale activity in any securities or other instrument should be based upon your own analysis and conclusions. Past performance is not indicative of future results. Either Qwest or Mr. Hui may hold or control long or short positions in the securities or instruments mentioned. 

Too much bullishness?


Author Cam Hui

Posted: 04 July 2012

This morning, Mark Hulbertreported that he was seeing too much bullishness among market timers:

Consider the average recommended equity exposure among a subset of the shortest-term stock market timers tracked by the Hulbert Financial Digest (as measured by the Hulbert Stock Newsletter Sentiment Index, or HSNSI). It currently stands at 47.0%.

To put the 47.0% recommended exposure into context, Hulbert wrote:

Particularly disturbing is that the HSNSI is now higher than where it stood on May 1, when the bull market that began in March 2009 hit what so far is its highest closing level. It’s five percentage points higher, in fact, even though the Dow is more than 400 points lower today than then.

When I read commentary like that, I like to look for confirmations from other data sources – but I didn’t find it. I don’t know what Hulbert’s sample composition is, but the July 2 Ticker Sense blogger sentiment poll, to which I am a participant (and I voted “neutral”), shows a high degree of disagreement between the bulls and bears:

There are a few explanations for this discrepancy. The sample surveys of the two polls are different, which can lead to differing conclusions. Another explanation could be a difference in methodology. Hulbert measures the average recommended exposure, while the Ticker Sense poll just asks about direction, i.e. if you are bullish or bearish. The bullish timers polled by Hulbert could be extremely bullish, while the bearish timers were only cautiously bearish. Such a result would skew HSNSI and pull the average up far more than “normally” warranted.

Any way I look at it, this doesn’t look like a case of excessive bullishness to me.

Cam Hui is a portfolio manager at Qwest Investment Fund Management Ltd. (“Qwest”). This article is prepared by Mr. Hui as an outside business activity. As such, Qwest does not review or approve materials presented herein. The opinions and any recommendations expressed in this blog are those of the author and do not reflect the opinions or recommendations of Qwest.

None of the information or opinions expressed in this blog constitutes a solicitation for the purchase or sale of any security or other instrument. Nothing in this article constitutes investment advice and any recommendations that may be contained herein have not been based upon a consideration of the investment objectives, financial situation or particular needs of any specific recipient. Any purchase or sale activity in any securities or other instrument should be based upon your own analysis and conclusions. Past performance is not indicative of future results. Either Qwest or Mr. Hui may hold or control long or short positions in the securities or instruments mentioned.

Are market expectations too low?

Posted: 03 Jul 2012 12:01 AM PDT

The market expectations going into the European summit last week was extremely low. When the leaders of Europe announced the usual plan to have a plan, the markets surged. Despite the weekend’s chorus of how the devil is in the details of the plan and why the plan won’t work, European stock markets continued to rise on Monday.

This begs the question: Are market expectations too low? As I wrote last week, read the market reaction, not the Summit statement.

The Chinese hard-landing story
Consider the case of how the market is reacting out the story on China and the possibility of a hard landing. On the weekend, Barron’s published a cover story called Falling Star, summarized by the subtitle “The Chinese economy is slowing and is likely to slow a lot more. Get ready for a hard landing.”

China, the article says, is an accident waiting to happen. The points made aren’t anything new for those of us who have been watching China for a while:

After three decades of annual growth averaging 10%, China’s bullet-train economy is slowing markedly. Economic problems in Europe and the U.S. are stunting export growth, long the primary driver of China’s economic miracle. Growth in industrial production has likewise been decelerating for months. This year growth in gross domestic product could slip to 8%—and it may get a lot worse from there. Though recently announced interest-rate cuts and a ramp-up in the government’s already massive infrastructure spending could postpone the day of reckoning, to us it looks like the Great China Growth Story may be falling apart.

For those without a Barron’s subscription, Josh Brown has a good summary of the article here.

Overnight, both China’s official PMI fell to 50.2 from 50.4 and the HSBC manufacturing PMI fell to 48.2, indicating weakness.

What did the market do in the face of all these negative stories? The Shanghai Composite ended up flat on the day Monday and rose on Tuesday. In my last post (see Can China hold things together?), I pointed out a number of extreme risks that are not outlined in the Barron’s article, but current market conditions indicate few signs of financial stress.

Is the US slowing?
As the sun rose on Monday across the globe, individual country PMIs were reported and the reports were generally punk. Contraction, rather than expansion, was the word of the day. As the US market opened, the Markit US PMI came in weaker than expected and ISM missed with a 49.7 reading, compared to market expectations of 52.0. Ed Yardeni has a good post summarizing the broad nature of the slowdown. He cites initial unemployment claims, durable goods orders, regional business surveys, consumer sentiment and consumer spending as sources of economic weakness.

Treasuries rallied hard on the news of economic weakness, but stocks ended the day flat.

On the other hand, housing is showing signs of a rebound. The New York Times reported last week:

Announcements of a housing recovery have become a wrongheaded rite of summer, but after several years of false hopes, evidence is accumulating that the optimists may finally be right.

The housing market is starting to recover. Prices are rising. Sales are increasing. Home builders are clearing lots and raising frames.

Calculated Risk also pointed out that the number of cities with increasing prices were on the rise.

What’s going on? Is the American economy tanking or recovering? If housing is indeed recovering, or even stabilizing, it would provide the underpinnings of a bullish impulse for stocks. The New Deal Democrat has an insightful post where he believes that housing is shaping up to be the stealth (bull) story of the year.

A NFP preview
Friday’s NFP release will be one of the first acid tests of the bull/bear debate on the US economy. The consensus expectations for this month is 80K, which seems very low to me. Gallup does a daily survey of the employment situation, which suggests that while the raw unemployment rate will be unchanged from last month, the seasonally-adjusted unemployment rate will fall.

If I were a betting man, I would take the “over” bet on NFP this Friday. If I am right, it would mean another relief rally because market expectations have been racheted down too low.

Don’t get me wrong. My inner investor continues to be very nervous about the macro backdrop. The global economy is weakening. Europe just kicked the can down the road by a few weeks and Greece will undoubtedly fall apart again before the end of 2012. I am also concerned about the tail-risk of a black swan event coming out of China.

My inner trader is telling me that we are poised for a relief rally on any form of good news, largely because expectations are too low. Enjoy the party but stay close to the exits.

Cam Hui is a portfolio manager at Qwest Investment Fund Management Ltd. (“Qwest”). This article is prepared by Mr. Hui as an outside business activity. As such, Qwest does not review or approve materials presented herein. The opinions and any recommendations expressed in this blog are those of the author and do not reflect the opinions or recommendations of Qwest.

None of the information or opinions expressed in this blog constitutes a solicitation for the purchase or sale of any security or other instrument. Nothing in this article constitutes investment advice and any recommendations that may be contained herein have not been based upon a consideration of the investment objectives, financial situation or particular needs of any specific recipient. Any purchase or sale activity in any securities or other instrument should be based upon your own analysis and conclusions. Past performance is not indicative of future results. Either Qwest or Mr. Hui may hold or control long or short positions in the securities or instruments mentioned.

Not enough panic?


Author Cam Hui

Posted: 25 May 2012

As stocks have descended in the last few weeks, investor sentiment measures have moved into zones indicating excessive fear. As an example, the Citigroup Panic/Euphoria model is in the “panic” territory, which is contrarian bullish.

Numerous other indicators, such as the Ticker Sense Blogger Survey, to which I contribute and voted “bearish” last week, also confirms the observation that there are too many bears.

Watch what they do, not what they say
What’s bothering me is that while all these sentiment surveys point to excessive bearishness, market based indicators such as the VIX Index is not showing very much fear at all.

Remember, what what they do, not what they say. While I have written before that this market is deeply oversold and due for a relief rally, these readings are suggestive that there is more downside before we see an intermediate term bottom.

Cam Hui is a portfolio manager at Qwest Investment Fund Management Ltd. (“Qwest”). This article is prepared by Mr. Hui as an outside business activity. As such, Qwest does not review or approve materials presented herein. The opinions and any recommendations expressed in this blog are those of the author and do not reflect the opinions or recommendations of Qwest.

None of the information or opinions expressed in this blog constitutes a solicitation for the purchase or sale of any security or other instrument. Nothing in this article constitutes investment advice and any recommendations that may be contained herein have not been based upon a consideration of the investment objectives, financial situation or particular needs of any specific recipient. Any purchase or sale activity in any securities or other instrument should be based upon your own analysis and conclusions. Past performance is not indicative of future results. Either Qwest or Mr. Hui may hold or control long or short positions in the securities or instruments mentioned.

Bond Market Bounces Back as Equities Stumble


Author Larry Berman

Posted: 1 May 2012 re-posted from etfcm

AGG: A few weeks ago many were calling for the end of the treasury bull market. The economy was recovering and yields were heading higher. Since that false start, Bernanke and the FOMC has reiterated the need to keep rates low through 2014 and that more QE is on the backburner if needed. And viola, the bond market has bounced back to near all-time highs as equities start to stumble. Investors can get used to this behaviour as we still see it lasting for years.

Emerging market debt (EMB) is somewhat overvalued given the inflation risks (real returns are extremely low), which suggests currency risks are rising. Peripheral Europe (IGOV) remains a basket case and currency risk is extremely high. High yield (JNK, ZHY) is more correlated to equity market risk and is showing strong evidence that we would want to avoid it for now. The global deleveraging that needs to take place will likely cause stress for the next decade. Significant defaults are likely before it ends and there is flight to safety value in the Treasury markets of Germany and the US. Japan may see some stress in bond yields, but QE will persist.


Gold Stocks and Bullion Potentially Form a Bottom


Author Larry Berman

Posted: 2 Apr 2012 re-posted from etfcm

The price action in the gold stocks and bullion in the past few weeks looks like a bottom formation. While we never know for sure without the benefit of hindsight, it does make sense to have exposure in the sector towards the higher end of maximum. But make no mistake, that the issues plaguing the gold sector in terms of political, labour violations, exponential rising costs, funding pressures, are all having a material impact on near-term valuations.

One industry report still looks to value revenues in the $1300 area, which is bordering on absurd. There is a group of analysts that are fist pounding bullish because of this perceived mispricing and yet the Street can’t seem to value these things at more than $1300 gold. Talk about a conundrum.

The bottom line is that governments around the world are bankrupt (fiscally and morally in many cases) and the only palatable way out is to print money and monetize the debt, because the longer-term fiscal (and moral) problems are simply TOO BIG TO SOLVE! Buy gold wear diamonds!

Can the bears take control from China?


Author Cam Hui

Posted: 21 Mar 2012

In the wake of the BHP Billiton warning about slowing steel demand growth in China, global equity markets deflated overnight. This incident illustrates the point I made earlier in the week about how the health of this equity rally depends on the American consumer.

Another market analyst made the point to me succintly about the lagging performance of commodities and commodity related stocks. The Aussie Dollar is underperforming the Canadian Dollar. Australia is more levered to China (and more weighted to base metals) while Canada is more exposed to the United States. If CADUSD is outperforming AUDUSD, then it’s a sign that the market believes that there is more near term economic upside in the US compared to China.

Bullish tripwires
I have made the point that depending on the American consumer to fuel this equity rally is a risky bet. If this rally is have any real legs, then we need to see a broader based rally around the world. Right now, the weak link is the Chinese outlook. As a pre-condition, commodity prices ideally should start to recover more and begin to take a leadership position in the next few months in order for this bull to get a second wind.

Here are what I am watching for. First, commodity sensitive currencies like the Aussie Dollar need to, not only hold support, but to show some strength and rally through resistance at 108.60.

Similarly, the Canadian Dollar, which has held up better than the AUDUSD exchange rate, needs to rally through resistance at 101.60.

Finally, I am watching the Hang Seng Index, which rallied up to 21,800 but couldn’t overcome the overhead resistance at that level. I view the more established Hong Kong market as an important barometer of Chinese policies towards the teetering property sector.

The Hang Seng is now approaching a minor technical support level. Should it decisively break support, that would be a sign that the bears have won a round in the bull-bear tug of war.

Cam Hui is a portfolio manager at Qwest Investment Fund Management Ltd. (“Qwest”). This article is prepared by Mr. Hui as an outside business activity. As such, Qwest does not review or approve materials presented herein. The opinions and any recommendations expressed in this blog are those of the author and do not reflect the opinions or recommendations of Qwest.

None of the information or opinions expressed in this blog constitutes a solicitation for the purchase or sale of any security or other instrument. Nothing in this article constitutes investment advice and any recommendations that may be contained herein have not been based upon a consideration of the investment objectives, financial situation or particular needs of any specific recipient. Any purchase or sale activity in any securities or other instrument should be based upon your own analysis and conclusions. Past performance is not indicative of future results. Either Qwest or Mr. Hui may hold or control long or short positions in the securities or instruments mentioned.

This bull depends on the US consumer


Author Cam Hui

Posted: 19 Mar 2012

I suppose I should be happy. I was correctly bullish on stocks and the Dow has decisively broken through the 13K mark, the NASDAQ Composite is through 3,000 and the SPX has rallied above 1,400. Positive momentum was confirmed by overseas markets such as the European markets, which also staged upside breakouts through technical resistance. It turns out I was right, but for the wrong reasons.

Surprising leadership
What’s been surprising to me is the nature of the leadership in this rally. This rally was underpinned by global central bank liquidity. The BoJ, BoE, ECB and the Fed have all undertaken some form of quantitative easing and the flood of liquidity usually buoys asset inflationary expectations, which leads to rallies in commodities, cyclicals and high beta growth groups such as emerging markets. This time, the leadership in equities has not been in those sectors, but something more unusual.

Consider where the leadership has come from in this rally. First of all, the usual defensive sectors such as Utilities and Consumer Staples are lagging (not shown). Next, we see a turnaround in Financials, which is consistent with the narrow miss from a global financial meltdown from the eurozone crisis. The chart below shows the relative performance of Financials against the market. The sector has turned around and staged an upside relative breakout, which is not surprising under the circumstances.

Next, we see surprising leadership from Consumer Discretionary, which is providing leadership as it is in a well-defined relative uptrend against the market.

In another surprise, we see a similar pattern with the Homebuilders.

There is also apparent leadership from Technology stocks, but the relative performance of Technology is mainly from a single stock: Apple.

Consider the relative performance of the equal weighted NASDAQ 100, which largely eliminates the price performance of AAPL. Views in this context, the relative performance of the Technology sector has actually stalled and it’s been rolling over in the last month or so.

What is surprising is that cyclical stocks are not showing the expected leadership in this rally, though they are participating in the upturn.

Neither are traditional high-beta groups like emerging market stocks.

Commodity prices, as represented by the CRB Index, are turning up – but the bull move has been anemic given the tsunami of central bank liquidity that’s hit the markets in the past few months.

The consumer ascendant?
What’s going on? What is the market saying?

I believe that the message of the market is growth depends upon the American consumer. We are seeing an unusual stock market leadership pattern and bond prices tanking (which I discussed in further detail here in my last post). What the market is saying, in effect, that the US economy is hitting escape velocity and growth, which is based on the US consumer, is starting to look self-sustaining.

Wow! The American Consumer is now the New Growth stock theme! Even The Economist is talking about a recovery – so it must be true.

True, the consumer is eating out more (see analysis here), which is a boost for Consumer Discretionary stocks. Housing seems to be stabilizing and showing uncertain signs of recovery, but there are indications that we are seeing a low quality housing recovery as the consumer seems to be trading down to mobile homes.

I was quite comfortable getting bullish based on a global central bank liquidity theme. As they say, “Don’t fight the Fed.” I am less comfortable with pinning my bullish outlook on the American consumer and robust US economy growth. With the ECRI sticking with its recession call, which is admittedly a fragile stick-your-neck-out call, this puts the rally on a less firm and riskier ground.

In fact, star bond manager Jeffrey Grundlach said in an interview that he expects bond yields to rise further and it would choke off any economic recovery:

Veteran bond investor Jeffrey Gundlach, who runs $30 billion at DoubleLine Capital in Los Angeles, said yields could rise further but the 10-year yield would have trouble holding much above 3 percent because that level would hurt the economy.

“Now that Treasuries have broken out to higher yields after six months of mind-numbingly low volatility, it is logical to expect the move to higher rates to last more than one week,” Gundlach said. “The way things look today I think a move toward 3.25 percent would weaken the economy noticeably.”

To be sure, high frequency economic releases have been coming in mainly above expectations, but insiders have been selling heavily, which is bearish. Looking globally, it’s not clear at all that this recovery is self-sustaining at all. To put the burden of the stock market rally on the US economy and consumer is indeed a heavy weight to bear.

The CRIC Cycle: Crisis, Response, Improvement, Complacency
Does this mean that investors should sell all their stocks and run for the hills? Not yet. Barry Ritholz wrote about what he termed the CRIC Cycle.

1. Response: When any crisis reaches a panic stage, authorities will typically react (and overreact) creating an overwhelming response to the crisis. This usually includes lots of cash and some immediate legislative relief.

2. Improvement: This response throw enough money at the problem that symptoms are temporarily relieved. The improvement is not structural, but rather, is driven by a sugar rush of excess liquidity. It feels good but it is not economically nutritious.

3. Complacency: The baling wire, chewing gum and duct tape improvements of the temporary patchwork repair creates a false sense of accomplishment. The improvements feel good, the data improves, markets rally. This leads to a sense of complacency amongst all parties (Government, private sector, banks, consumers, etc.)

4. Repeat: With few of the structural problems fixed, the excess liquidity eventually flows to the same sources of the original crisis, setting the stage for the next crisis .

He went to say that he believed the US is in the late stages of this cycle:

Bringing us up to date, the US appears to be deep in the Complacency stage. Things have noticeably improved, but the structural problems underneath remain.

In Europe, we seem to be late in the Response phase, awaiting the early Improvement part of the cycle to kick in.

I agree with his assessment. The chart below of a ten year history of the ratio of SPY (stocks) to TLT (long Treasury bonds) as a measure of the risk-on/risk-off tells me that this risk-on rally has further upside potential as risk appetites are only normalizing.

The Ritholz wild-eyed guess scenario, which he wrote on February 21, 2012 before the brief market downdraft, is sounding more and more plausible:

If the past is prologue (and that cannot be relied upon), we could see a scenario something like this (Note: Wild ass guessing to follow). Markets kiss 13,000, pullback and consolidate. But they are not overbought sufficiently for anything more serious than a modest retracement, and so they continue higher for several months, until the % of stocks over 200 day MA is near 90% (they are at 75% today). That takes us somewhere between March and June. The next sell off begins, lopping 25% or so off of the SPX. The Federal Reserve waits until after the November election to introduce QE3, and the cycle starts anew.

My inner investor remain bullish, but he is a nervous bull. My inner trader tells me not to worry. These issues with the American economy and consumer are 3Q or 4Q problems. So let’s party on, but keep an eye out for the exit.

Cam Hui is a portfolio manager at Qwest Investment Fund Management Ltd. (“Qwest”). This article is prepared by Mr. Hui as an outside business activity. As such, Qwest does not review or approve materials presented herein. The opinions and any recommendations expressed in this blog are those of the author and do not reflect the opinions or recommendations of Qwest.


None of the information or opinions expressed in this blog constitutes a solicitation for the purchase or sale of any security or other instrument. Nothing in this article constitutes investment advice and any recommendations that may be contained herein have not been based upon a consideration of the investment objectives, financial situation or particular needs of any specific recipient. Any purchase or sale activity in any securities or other instrument should be based upon your own analysis and conclusions. Past performance is not indicative of future results. Either Qwest or Mr. Hui may hold or control long or short positions in the securities or instruments mentioned.